Water and energy are two essential resources and are in finite supply. This year’s UN Climate Conference expanded the global conversation about the development of new technologies, practices and solutions to balance the water-energy nexus.
“With challenge comes opportunities to invest in infrastructure and to scale innovative technologies that improve standards of living while building a greener future,” said Rice University alumna Kim Raath. “Quantitative research in recent years has focused on the financial linkages between water and energy markets and infrastructure.”
Raath is the chief technology officer of Imperative Global, a market-leading carbon offset project developer and operator. As CTO of the company since 2022, she is responsible for building out the company’s tech stack.
“Water is involved at many points in the process of producing energy – energy for human life in the production of food and energy needed to drive economies and sustain societies,” Raath said. “Both commodities are set to intensify in the coming future due to rising demands and constraints.”
Raath is the first author of an open-access paper published in November 2023 in Entropy. The paper, which builds on her doctoral research (2015-2020) on the energy-water nexus, is part of the journal’s special issue that features robust methods and complex scenarios and data visualization.
The paper, titled Denoising Non-Stationary Signals Via Dynamic Multivariate Complex Wavelet Thresholding, analyzes thousands of data points from June 2007 to January 2018 for each series of the Global Water Index ETF (CGW) and the largest energy sector ETF – the Energy Select SPDR Fund (XLE).
Co-authors include prodigious statisticians-data scientists David Scott, the Noah Harding Professor Emeritus, and Katherine Ensor, the Noah G. Harding Professor, both of statistics at Rice University, and alumna Alena (Oetting) Crivello, who is a product manager of subsurface data science and analytics at Chevron.
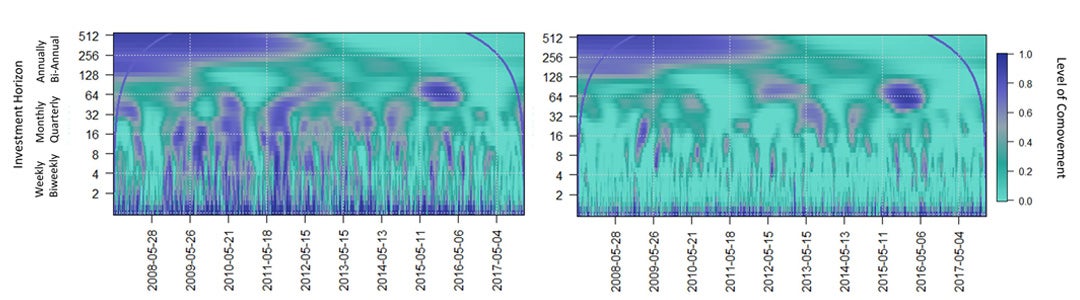
To understand the evolution and significant market movements during the time series, Raath’s and Ensor’s stochastic volatility models in time series also analyzed the co-movements that occurred, most notably during the financial crisis from 2008-2012 and the 2014-2016 global oil glut.
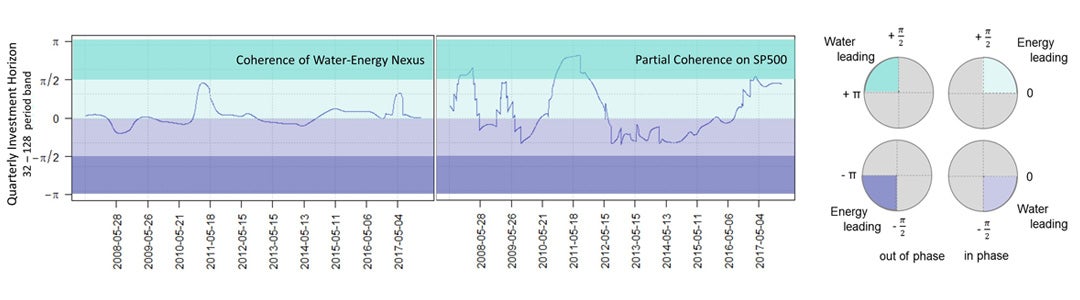
The research then tested the coherence of the two commodity markets by cross-analyzing the data with the SPDR S&P 500 ETF Trust (SPY), which includes companies in energy-related services and drilling as well as companies that produce and develop crude oil and natural gas.
There are many different types of wavelets used to evaluate signal patterns. For example, wavelet‐based methods have been used extensively in electrocardiograms (ECG) to analyze patients’ heart rates and identify features in cardiac arrhythmias.
In building the robust framework of their wavelet-based methods, Raath and Ensor collaborated with Scott, a globally recognized expert in multivariate density estimation and visualization.
Scott has published extensively on the use of novel continuous wavelet transform techniques and is the author of the book Multivariate Density Estimation: Theory, Practice, and Visualization (1992; second edition 2015). He also initiated five courses at Rice in statistical inference, nonparametric functional estimation, data mining and statistical learning, clustering and discrimination, and statistical computing and simulation.
In 2006, Scott and Crivello, who received her doctorate in statistics under Scott’s direction, applied Scott’s multivariate minimum distance partial density estimation called L2E to wavelet modeling that inspired Raath’s WaveL2E method, which denoises time series across time and for specific investment horizons (scales) and localized windows (blocks) of time, revealing different periodic components change over time.
“Statistics has two fundamental goals. The first is to understand the shape and nature of data. The second is to use data to predict,” said Scott.
Wavelet analysis is a powerful tool for the nonparametric estimation of temporally varying objects.
Scott explains, “Nonparametric estimation is used when you don’t know the formula for the curve. This is because you are solving a problem that has many parameters, or quite possibly an infinite number of parameters that span time. L2E measures the distance between the true curve and the probable curve to make the two as close together as possible.”
Through this process, Raath and Ensor were not only able to find the optimal signal but also estimate the variance of the noise component.
“Over the past decade, there have been significant advancements in graphical techniques that use wavelet power spectrum to summarize the evolution of dynamic time series behavior in finance,” said Ensor, who directed Raath’s doctoral research and has been director of CoFES since its founding in 2002.
Raath now serves as a board advisor to CoFES, Mercy Corps Ventures – an early-stage impact venture capital fund, and Xpansiv – the leading market infrastructure provider for the global energy transition.
“By denoising the price series, we form a deeper understanding of the relationship between the price series representing water and that representing energy. We also confirmed that the water–energy nexus depends on general market behavior,” Ensor said.
The development of robust methods and complex scenarios and data visualization is the basis of ongoing CoFES research using the CoFESWave R package, which implements the thresholds introduced in the paper to model non-stationary processes in economic and market behaviors.
“An added feature of our thresholding method is the estimation of the variance of the additive noise at specific localized windows of time. These estimates can be used to forecast the volatility series, work which will be further explored in future papers,” said Ensor.
- Shawn Hutchins, Communications and Marketing Specialist